
Parish Statistics
'Parish Spotlights' are generated by mission and finance statistics returned by parishes to the Department of Research and Statistics at Church House, Westminster.
These spotlights aim to bring together a range of information about each congregation and on the wider community living in the area.
They include 'barometer readings' of how parishes are doing and include helpful suggestions for future work.
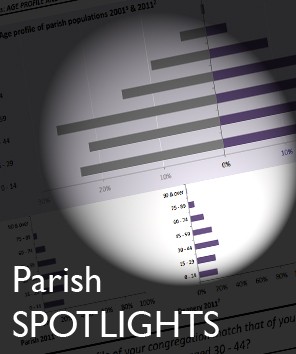
Topics include Christian affiliation, population age and ethnicity profiles, household structures, deprivation, employment, schools and qualifications, alongside church statistics such as attendance and giving.
The spotlights also include questions for parishes to consider.
Click here to find your Spotlight (from 2012)
If you have any problems with access, contact:
parishsupport@salisbury.anglican.org
Amendments
To suggest specific amendments for a particular Spotlight, please email queries to statistics.unit@churchofengland.org.
Additional information on how Spotlights are compiled is included below. This should help you to understand the data and answer queries you may have.
Additional Information on Parish Spotlights
Attendance and Finance Data
Attendance and Finance data have been compiled from annual parochial returns. As you will be aware we do not get a 100% response rate each year. Attendance data in this spotlight do not contain any estimates however Finance data may. This will be flagged as appropriate. The Spotlights are at the parish level, so where there are statistics for multiple churches in a parish, these have been amalgamated. Where there have been pastoral reorganisations the data may show jumps in figures, or gaps in the data.
Parish Structures
These spotlights have been compiled using the department’s best knowledge of the geographic make-up of the country. If your churches work outside the parish system, or work in different geographies such as conventional districts or guild churches they may not appear in the list of Spotlights however the population data for the geographic parish overlaying the area will be of relevance. If there are specific areas for which you would like a community focused spotlight, without annual parochial returns data, or with annual parochial returns data for different churches then please do contact them with further details about these areas.
These structures are accurate as at March 2013, however the annual parochial returns data are accurate as of 2011, so in areas of considerable pastoral reorganisation there may be mismatches between the geography and the churches for which the annual parochial returns data refer. Once again, please do contact them if there are any specific areas for which you would like us to produce a revised spotlight.
“Centroid” and “Non-centroid” Spotlights
The community data is based on various government sources, including the 2011 census. Government boundaries do not match our ecclesiastical parish boundaries, so best fit modelling is required. The method used is to take the smallest geography for which population data are released (now Post Code level), represent that area with a single dot (placed in the middle of where the people live in that area, called a “Centroid”), and then allocate that population to the parish within which the dot falls. This gives the parish its population count and is a standard best-fit modelling technique (see the “centroid Spotlights” folder).
It does mean, however, that for some parishes no dot falls into the boundary, so we are not able to allocate a population count (see the “non-centroid Spotlights” folder). For these parishes we have given some broad percentages to reflect the population instead.
Government data are published on government boundaries that do not match ecclesiastical boundaries. In order to produce parish population and demographic estimates we have worked with the ONS to use a best fit modelling process. As such, these statistics can only be considered estimates and, particularly in very diverse areas, are best used in the context of local knowledge. Where parish populations are sparse the figures for government areas overlapping the parish are used. Parish estimates from the census have been calculated using the census postcode population headcounts published by the ONS.
The parish population count is the sum of all postcode headcounts within a parish. Proportions for characteristics of the population from the Output Area Census data are then applied to the postcode headcounts and summed to get parish figures. Where parishes have not been allocated population as no postcode centroids fall within the parish boundaries, proportions for demographic variables have been calculated based on the output areas overlaying the parish.
'Church Statistics Only' Spotlights
There are a number of parishes where we have annual parochial returns data, but we cannot allocate this to a geographical are on the ground (and therefore community data). This could be due to pastoral reorganisation, or churches that work outside the parish system. These are included as a series of Spotlights with very limited data for your information.
Excel Files
Excel files of the community focussed data are available on the Church of England website: www.churchofengland.org/about-us/facts-stats/research-statistics/census-2011.aspx
Document Actions